Introduction
Computational biology is an interdisciplinary field that connects computer science, biology, and statistics, data science, which has a relatively big overlap with Bioinformatics.
In this blog, I will introduce some Bioinformatics tools and databases as well as some basic concepts and algorithms of computational biology. This will help beginners better understand how computational biology works and how to design a computational biology research project or compensate your research with some Bioinformatics analysis. The main content of this instruction refers to the “Elements of Bioinformatics” courses in the autumn of 2024 at Geneva and “Bioinformatics Algorithms: An Active Learning Approach” published by Phillip Compeau and Pavel Pevzner in 2015.
Outline
Red Color Font are the parts still under construction
- Preface
- Main Biological Databases
1.0 Servers
1.1 Sequence database(Protein, DNA, RNA…)
1.2 Genomic Database
1.3 Protein structure databases
1.4 Other biological databases - Bioinformatics and Computational Biological Analysis Methods
2.1 Gene Ontology and its associated analysis methods
2.2 Gene annotation: recognizing the structure of gene automatically
2.3 From pattern to domain: identify protein consensus sequences
2.4 Homologs identification: a method to review the relationship between proteins
2.5 Protein Structure Prediction: from the past to future
2.6 Constructing a phylogeny trees with NG Phylogeny - Some basic algorithm of Computational Biology
3.1 BLAST
3.2 Pair-wise alignment
3.3 Multiple sequence alignment(MSA) - My understanding of system biology
0. Preface(This section does not refer to any sources)
Before the main part, I’d like to clarify the definition of the two terms: Bioinformatics and Computational Biology. Since befofe we learn something, it would be better that we can have a whole picture of what you are going to learn.
Bioinformatics is an interdisciplinary field that applies computational methodologies for managing and interpreting large-scale biological data. A typical bioinformatics study involves four key steps:
- Data Acquisition
- Data Storage
- Data Distribution
- Data Analysis
From these four elements, you must notice that bioinformatics extremely focouses on the word “data“, which is the core of bioinformatics.
Generally speaking Bioinformatics often focuses on building and using software tools and databases, It not so much a systematic discipline as a collection of utilities to address biological problems from the data collected from different database or experiments. Thus, an outstanding bioinformaticians must have a strong ability of data analysing and data mining.
In contrast, computational biology is a systematic discipline that merges biology, computer science, mathematics, and statistics to tackle a wide range of biological questions. The main elements involved in computational biology is:
- Simulating Biological process with Methematical models
- Predicting information with Statistical Learning methods
- Designing or Improving Bioinfo-tools using computational algorithms
Computational biology is a high-level interdiscipline(there’s no “Computational Biology” major in undergraduate study) which emphasizes intergrating algorithms and the development of theoretical models to address specific biological problems. It incorporates various methodological and conceptual approaches—such as machine learning, mathematical modeling, and simulations to explore complex biological systems in a more quantitative and predictive manner.
It’s important to tell the differences between Computational Biology and Bioinformatics, since the work they are doing is quite different, Bioinformaticians are basicly data analysts dealing with biological data, which is what we called “Dry lab work”, while Computational Biologists are still biologist who are studying without tubes and various lab instruments, but with Computers and different models as we mentioned above.
Knowing the difference between these two terms, you also need to realize how far you want to achieve based on our goal.
If you want to be a Bioinfor Data analyst, or want to use bioinformatics to support your experimental results, it would be enough for you to get familar with different databases, bioinformatics tools and at least one coding language(Python or R) for analysing data and writing scripts (I assume you already known the basis of Moleular Biology and Biochemistry). A good bioinformatician can be trained by performing data analysing tasks to accumulate experiences and improve the efficiency.
In contrast, if your goal is to be a computational biologist who can perform research to answer scientific questions without microscopes and enzymes but with computers everywhere, it’s both necessary to learn the fundmentals of Biology and computer science, find and address problems from the perspective of both discilines. These abilities(scientific thinking, problem addressing, and interdisciplinary views…) is usually be trained when actually dive into an science environment, and the journey of computational biologist only start after or during finishing a PhD degree.
1. Main Biological Databases
Databases are usually a collection of structured and searchable data, and these data are also updated periodically, different databases often have crosslink which can link to other database. They are usually very powerful tools for data mining or finding the reference of your research.
1.0 Servers
A webserver is a computer(from a given insititute) that provide services(databases and tools) to other computers.
There are 5 main biological servers:
- NCBI
- UniProt (Maintained by SIB, EBI and PIR)
- ExPASy(Maintained by SIB)
- EBI
- JapaneseGenomeNet
1.1 Sequence databases
Regarding the sequence databases, in biology, it usually refers to DNA, RNA and Protein sequence data. As shown in Figure 1, for DNA, RNA sequences data, ENA, GenBank and DDBJ (Primary archives) are usually the major databases accepting sequence submission from researchers and these data usually comes from direct sequencing.
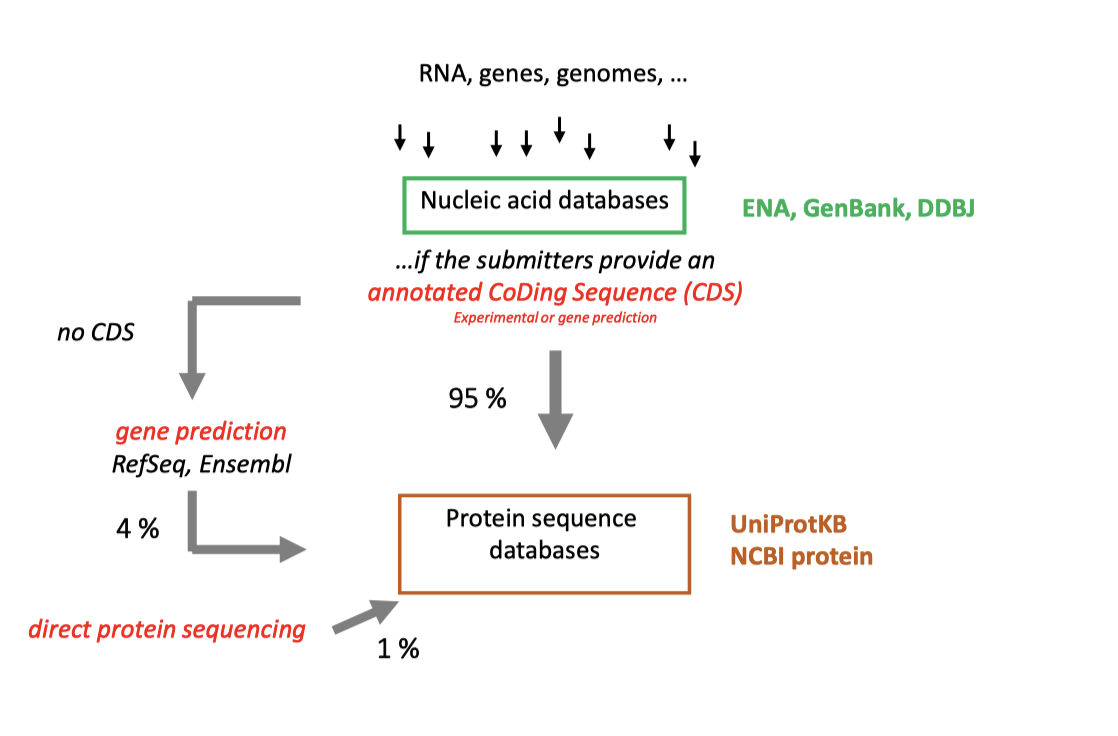
Fig 1. Origin of Sequence
An important feature of these primary archives is highly redundant(which means nothing goes out) and their annotations are not updating, so there are many errors in both sequences and annotations.
Refseq, Ensembl (Figure 2)take sequences from primary archives, and apply quality control and gene annotation pipeline to provide the “reference” annotations.
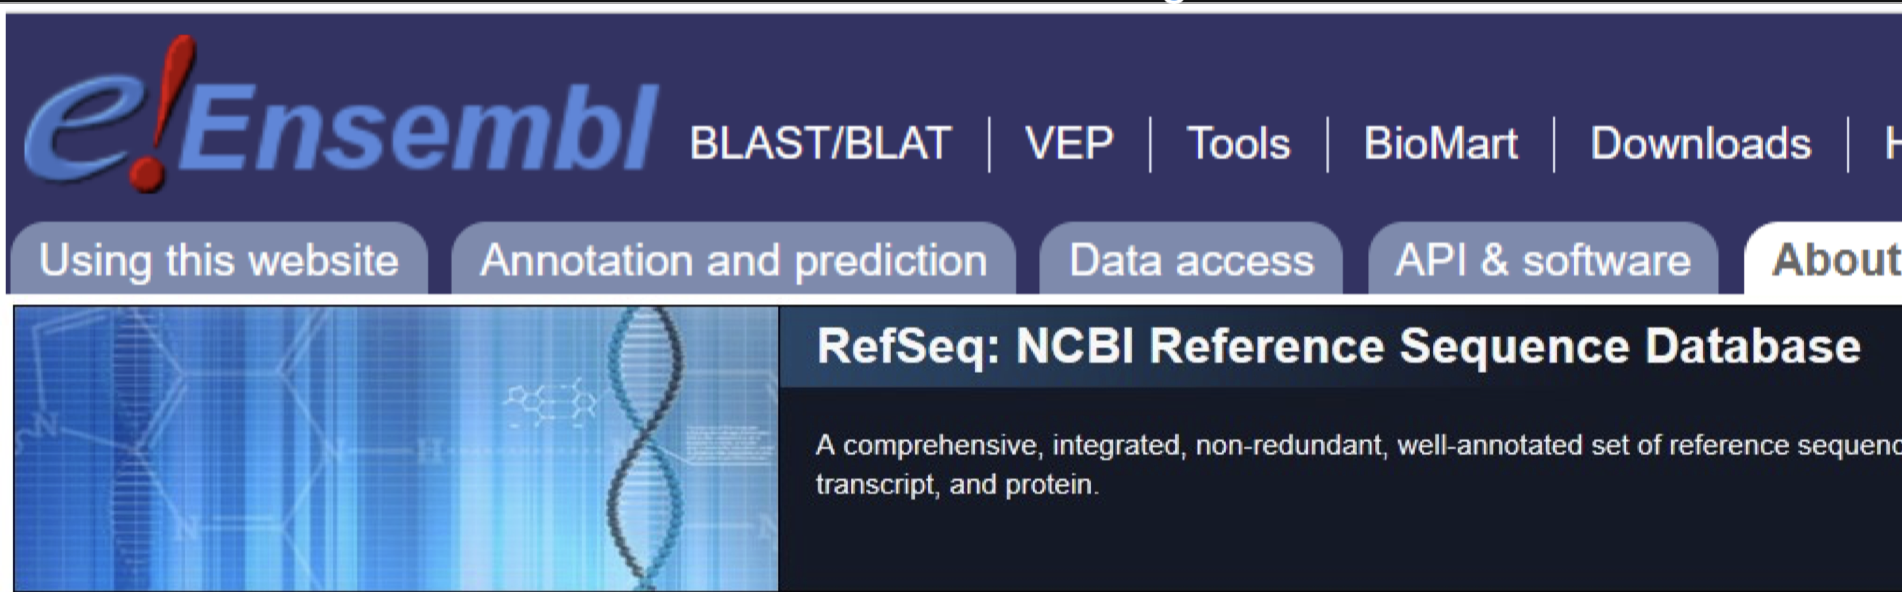
Fig 2. Ensembl and Refseq
In Refseq and Ensembl, we can also find the protein sequences derived from gene prediction, which are not submitted to the primary databases.
Note: Because of the different methods used for gene prediciton, the final number of proteins can also be different.
For protein sequences, a relatively large persentage of them comes from translations of the DNA sequences or predicting the gene structure and then deduce its products(about99%), only 1% come from direct protein sequencing.
Mostly used protein databese including UniProtKB and NCBI protein, both of them are intergrated databases, for UniProtKB, it intergrated data from PDB, PIR, PRF into it database. One of its sub database Swiss-Prot only contains canonical sequences, it usually has these features:
- One gene, one UniProtKB/Swiss-Prot entry.
- AlphaFold usually use the canonical sequences.
- Has annotations from manuel or experimental evidences.
TrEMBL is also a sub database of UniProtKB, but this is exactly the opposite of the Swiss-Prot, every entry of it corresponds to a single protein, instead of a gene, and its annotations are mostly generated automatically from diverse sources like Interpro predictions.
Their differences has been shown in the following Figure 3.
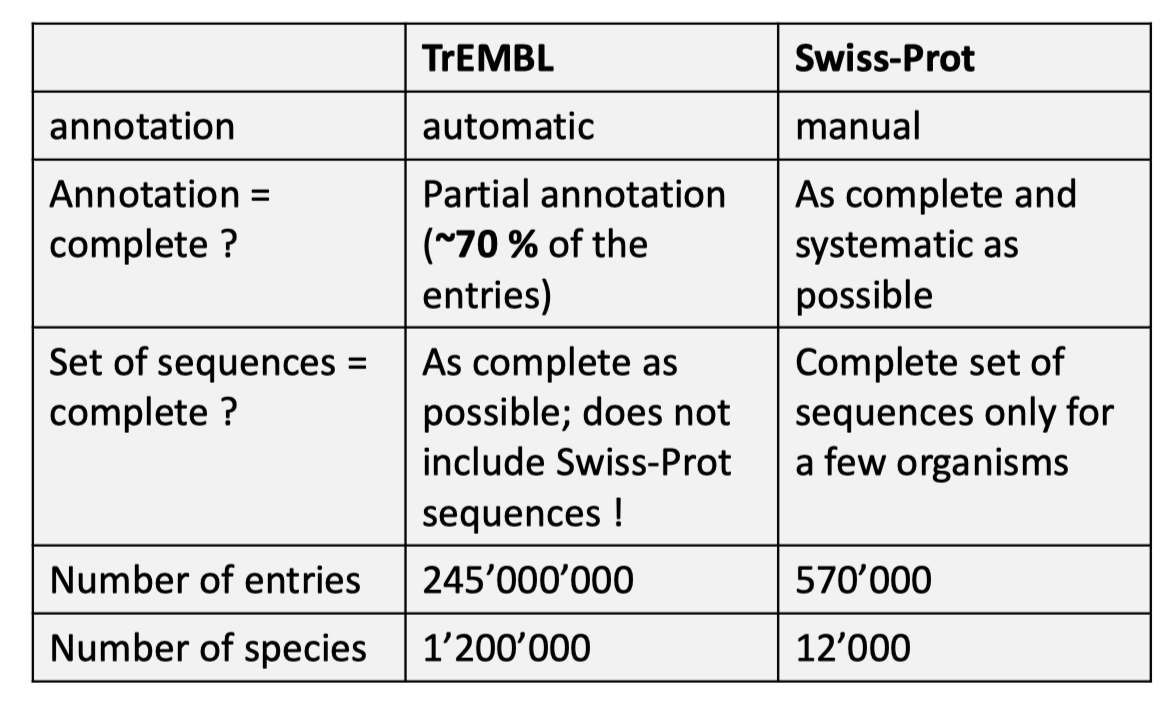
Fig 3. Differences between Swiss-Prot and TrEMBL
In contrast NCBI protein database did not intergrate PDB, PIR and PRF, instead, it provide these information sepratedly.
As the description and interface shown in Figure 4. NCBI protein database is not only have access to different data, it also provide access to some tools.
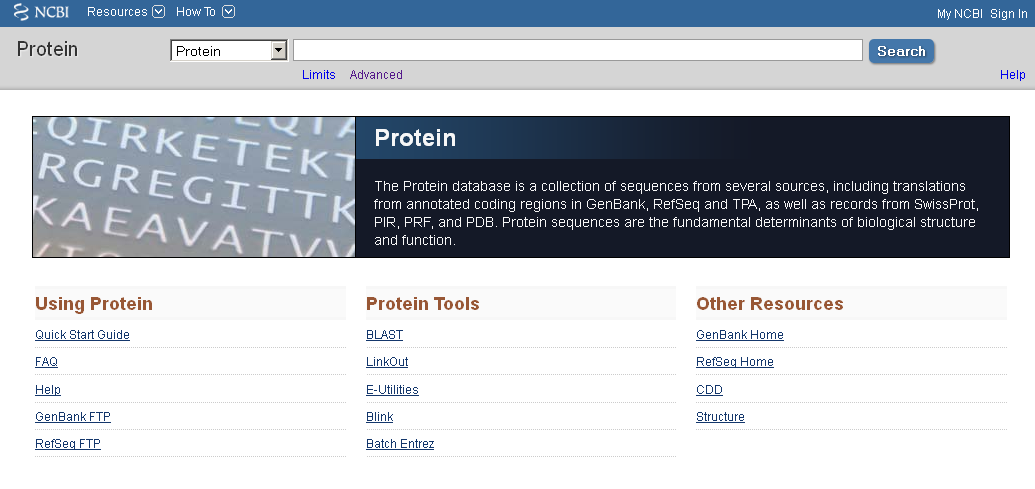
Fig 4. NCBI protein description
1.2 Genomic Database
Genomic databases are also called Model Organism Database(MOD), these database usually provide information on Genes, Chromosomal Location, Gene Expression, Mutations&Phenotypes and Homology of the model organisms, as shown in Figure 5, in addition to well-known mice, other model oragnisms including yeast, fruit fly, etc.
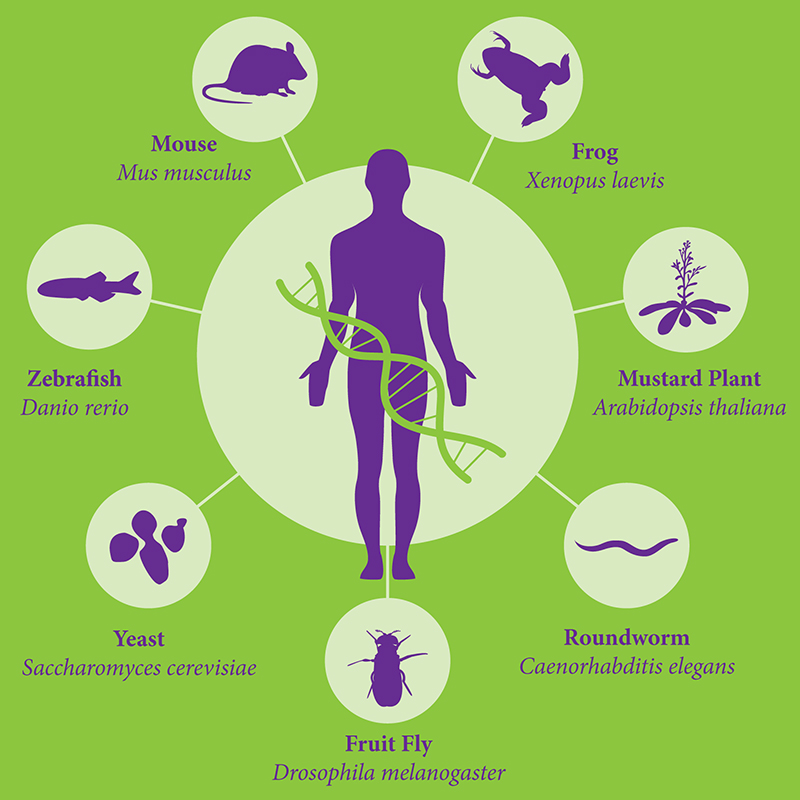
Fig 5. Model Oragnism
For most of the model organisms there exist an MOD of it, for example, we have OMIM(human), MGI(mouse), Flybase(Drosophila),SGD(yeast), MaizeGDB(maize), SubtiList(B.subtilis), ZFIN(zebrafish),Wormbase(C.elegan), Xenbase(frog).
These database typically include:
- Genome data: Genome sequence(only link to sequence database), gene annotations and variants.
- Phenotypic data: Traits associated with mutations.
- Functional data: Gene expression patterns, protein interactions as well as pathways
- Cross-reference links: Connects to relevant publications or databases
- Experimental tool: Some built-in tools for sequence alignment or genome browsing.
Here, we mainly introduce the human genomic database OMIM(Online Mendelian Inheritance in Man), in OMIM, there are in total 20300 genes in which 16800 of them has known biological function from UniProtKB, it focuses on the relationship between phenotype and genotype.
In OMIM database, the accesstion with a prefix “*” is a gene entry, in which we can find its associated diseases and other descriptions as shown in Figure 6.
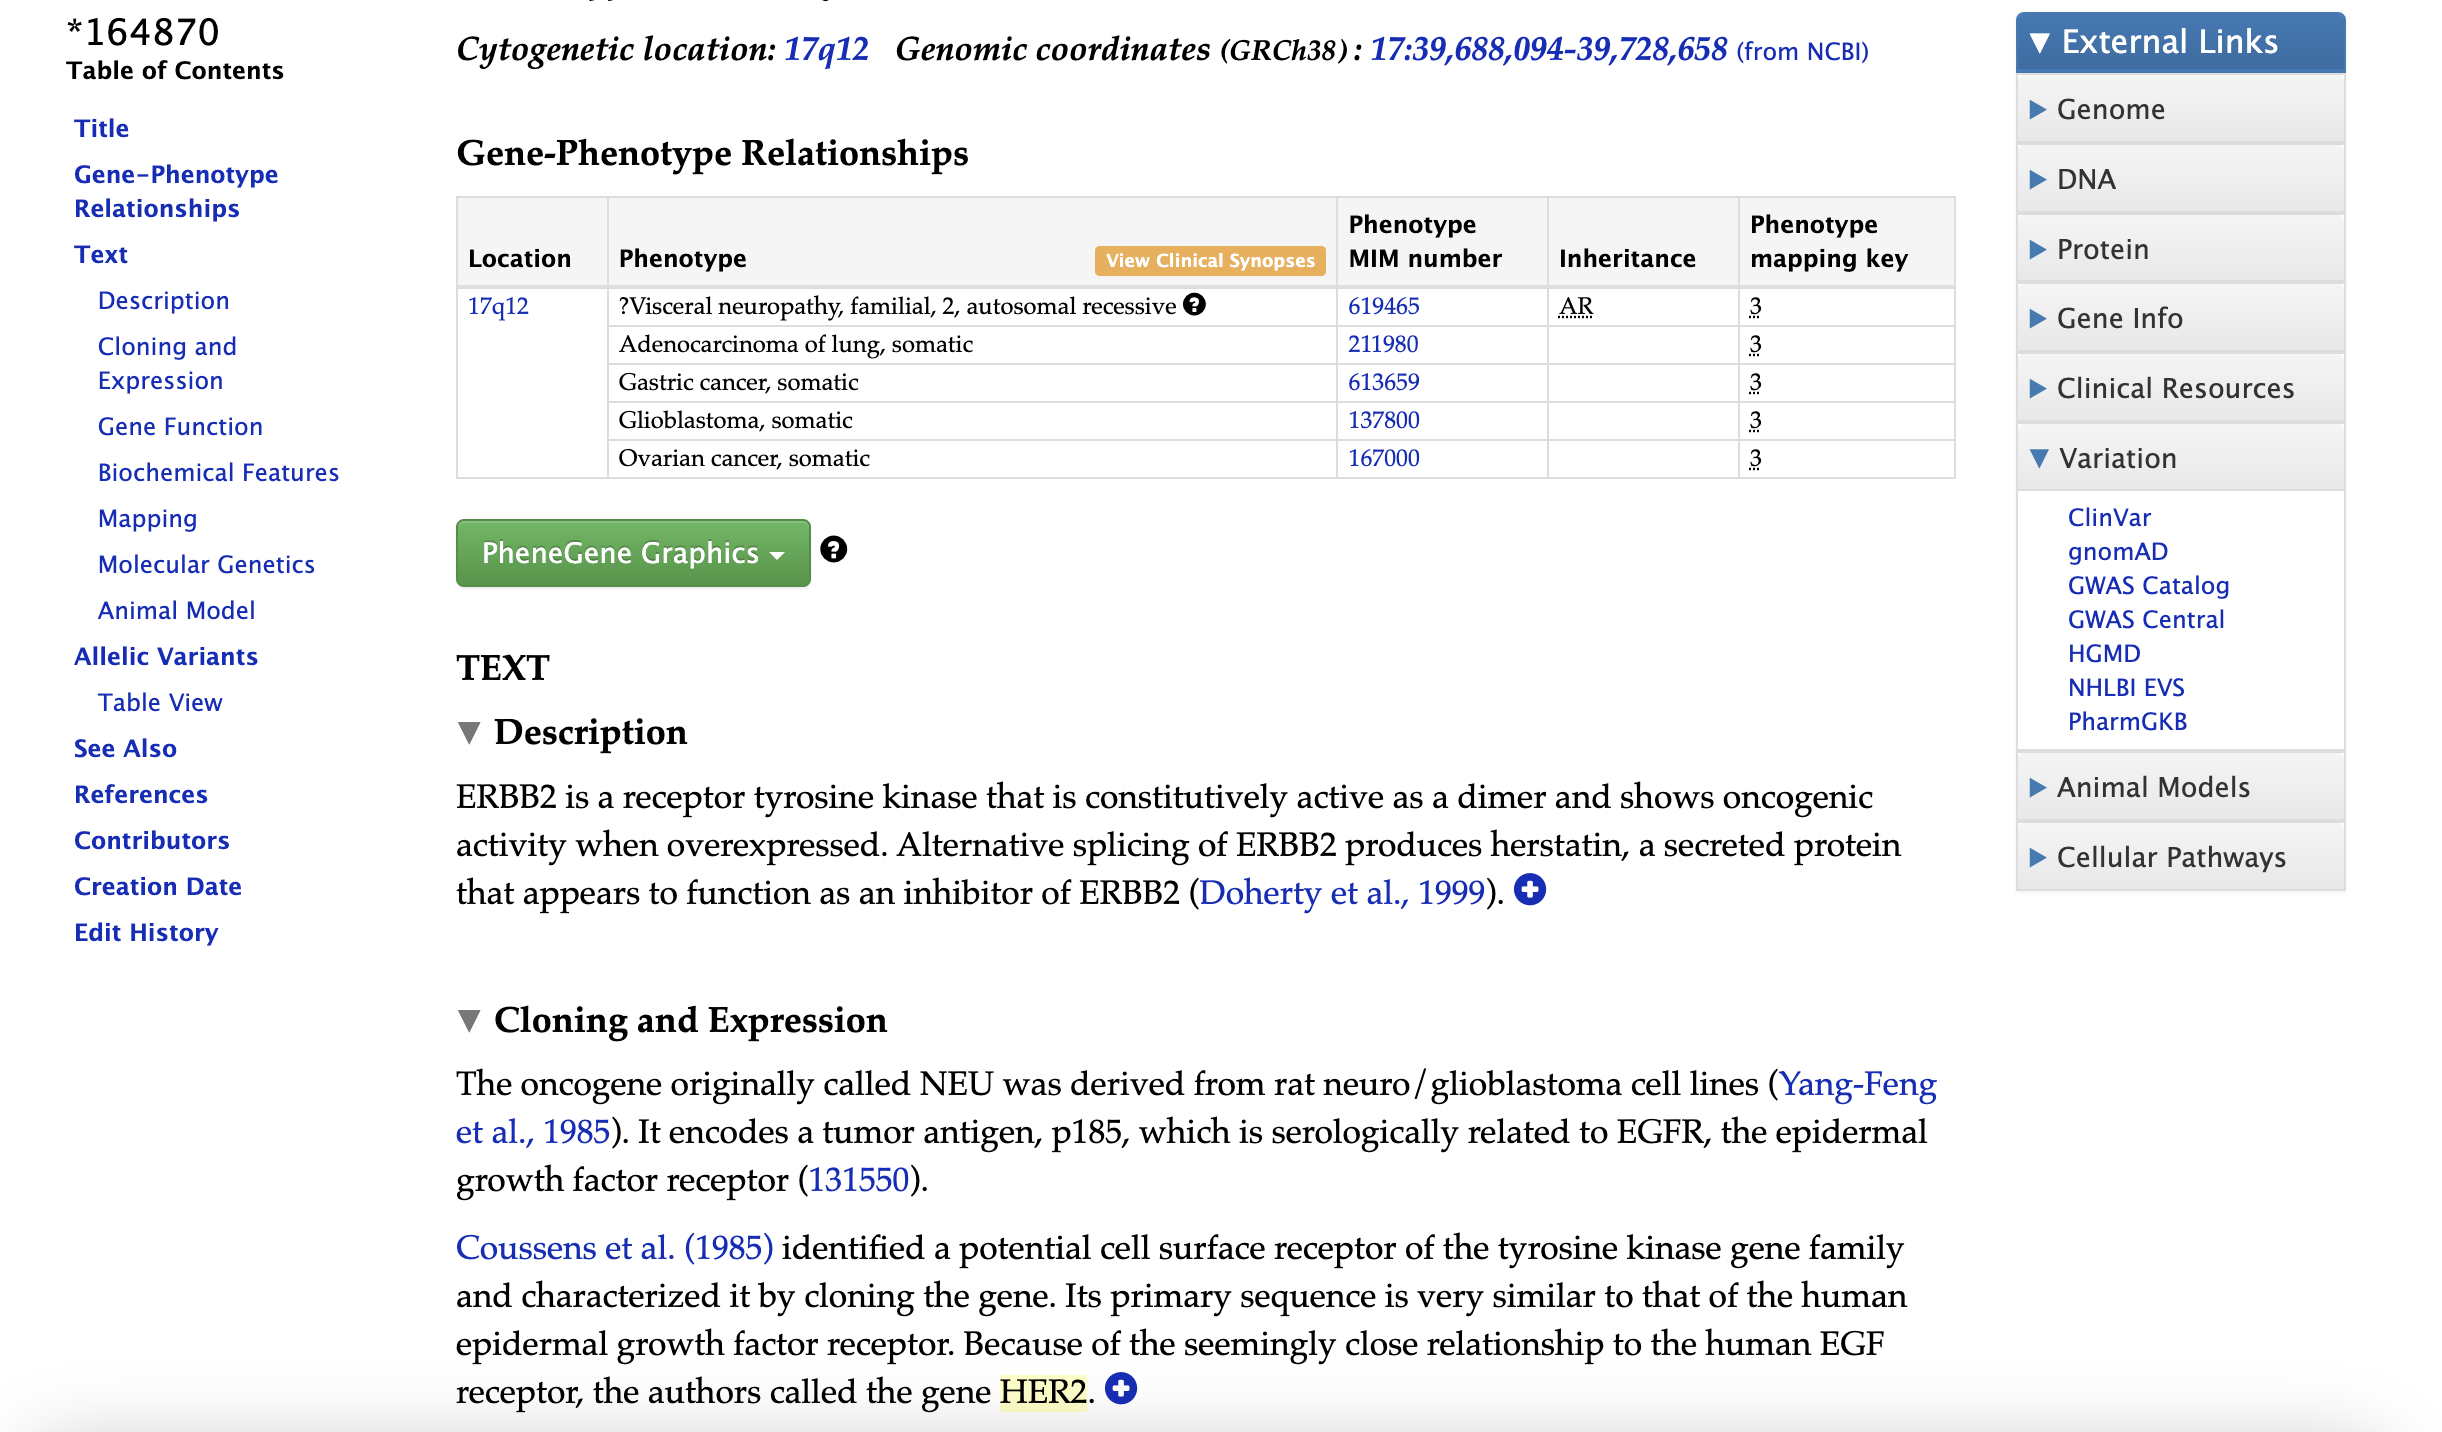
Fig 6. Example gene entry
For disease entry, the prefix will be “#”, as shown in Figure 7, the entry of disease usually gives the access to its clinical synopsis and its genetic relationships.
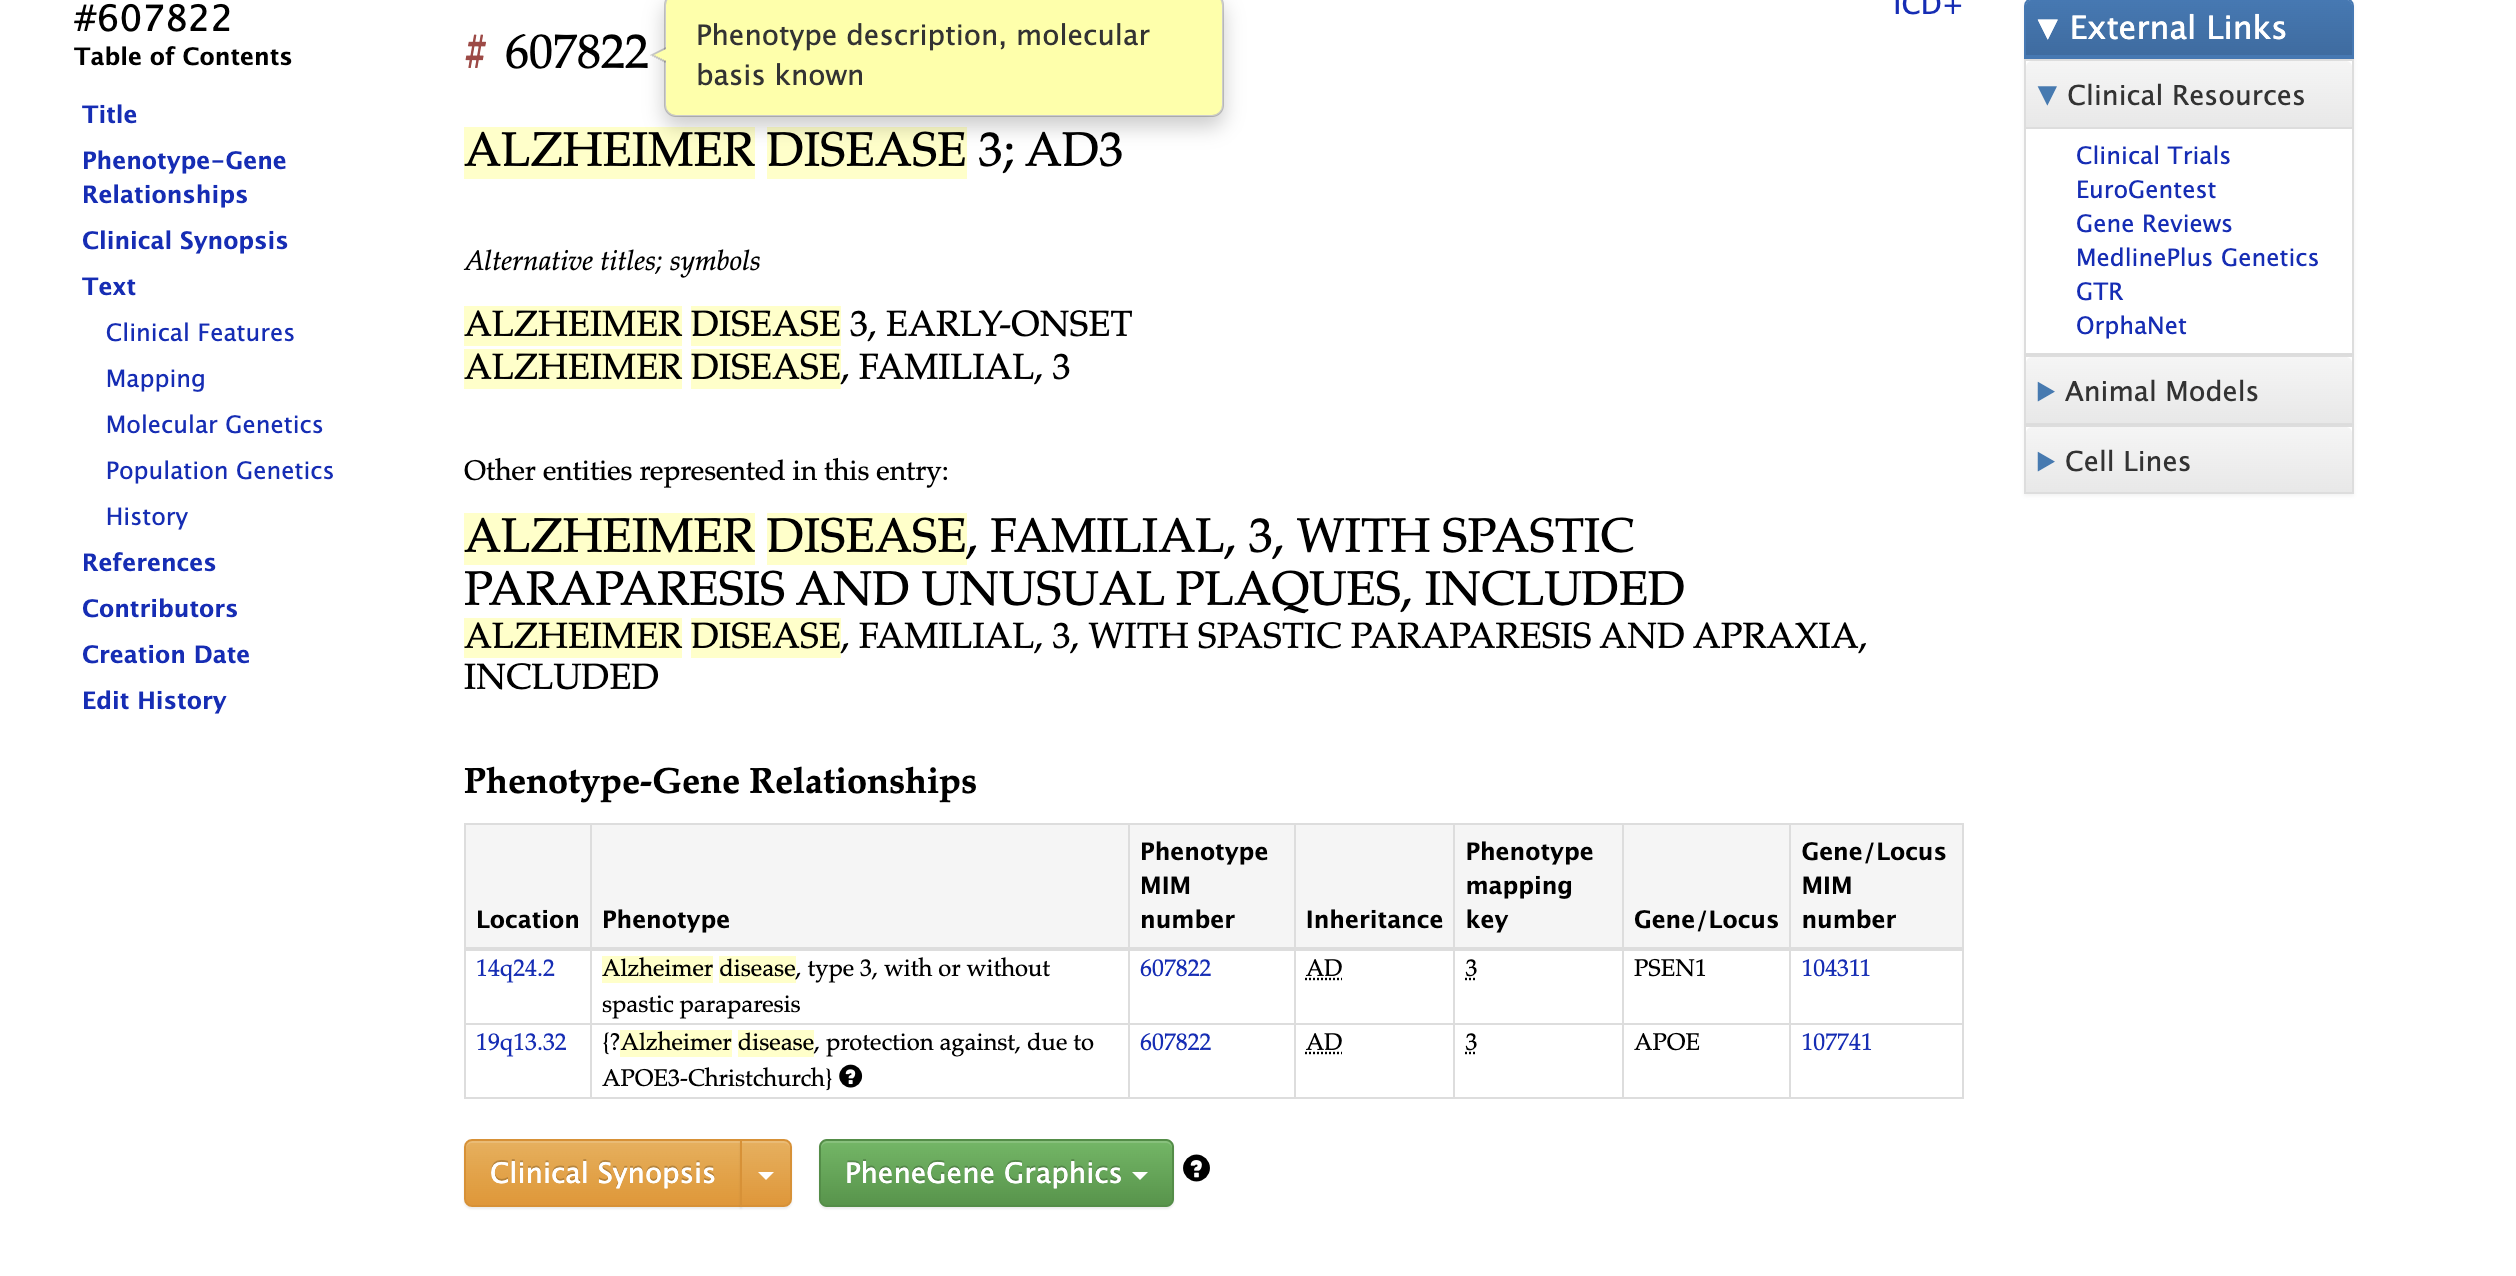
Fig 7. Example disease entry
Note: Most of the identified associated genes are “Markers” instead of actual causative variants.
An important tool for searching genome or reading genome information is Genome Browser, which allow us visualizing data(genome, SNPs, mRNAs) for a given gene. There are three most popular genome browser most often used:
1.3 Protein Structure Database
There is only one major protein structure database which is Protein Data Bank(PDB), but it can be accessed through different servers: RCSB, EBI, PDBJ.
In PDB database, it currently(till 2025.1.31) has 230000 protein structure data for 47000 proteins which is highly redundant. PDB database storing data in .pdb format, a .pdb file ussally looks like the Figure 8, it shows the spatial coordinates of each atom of each amino acid:
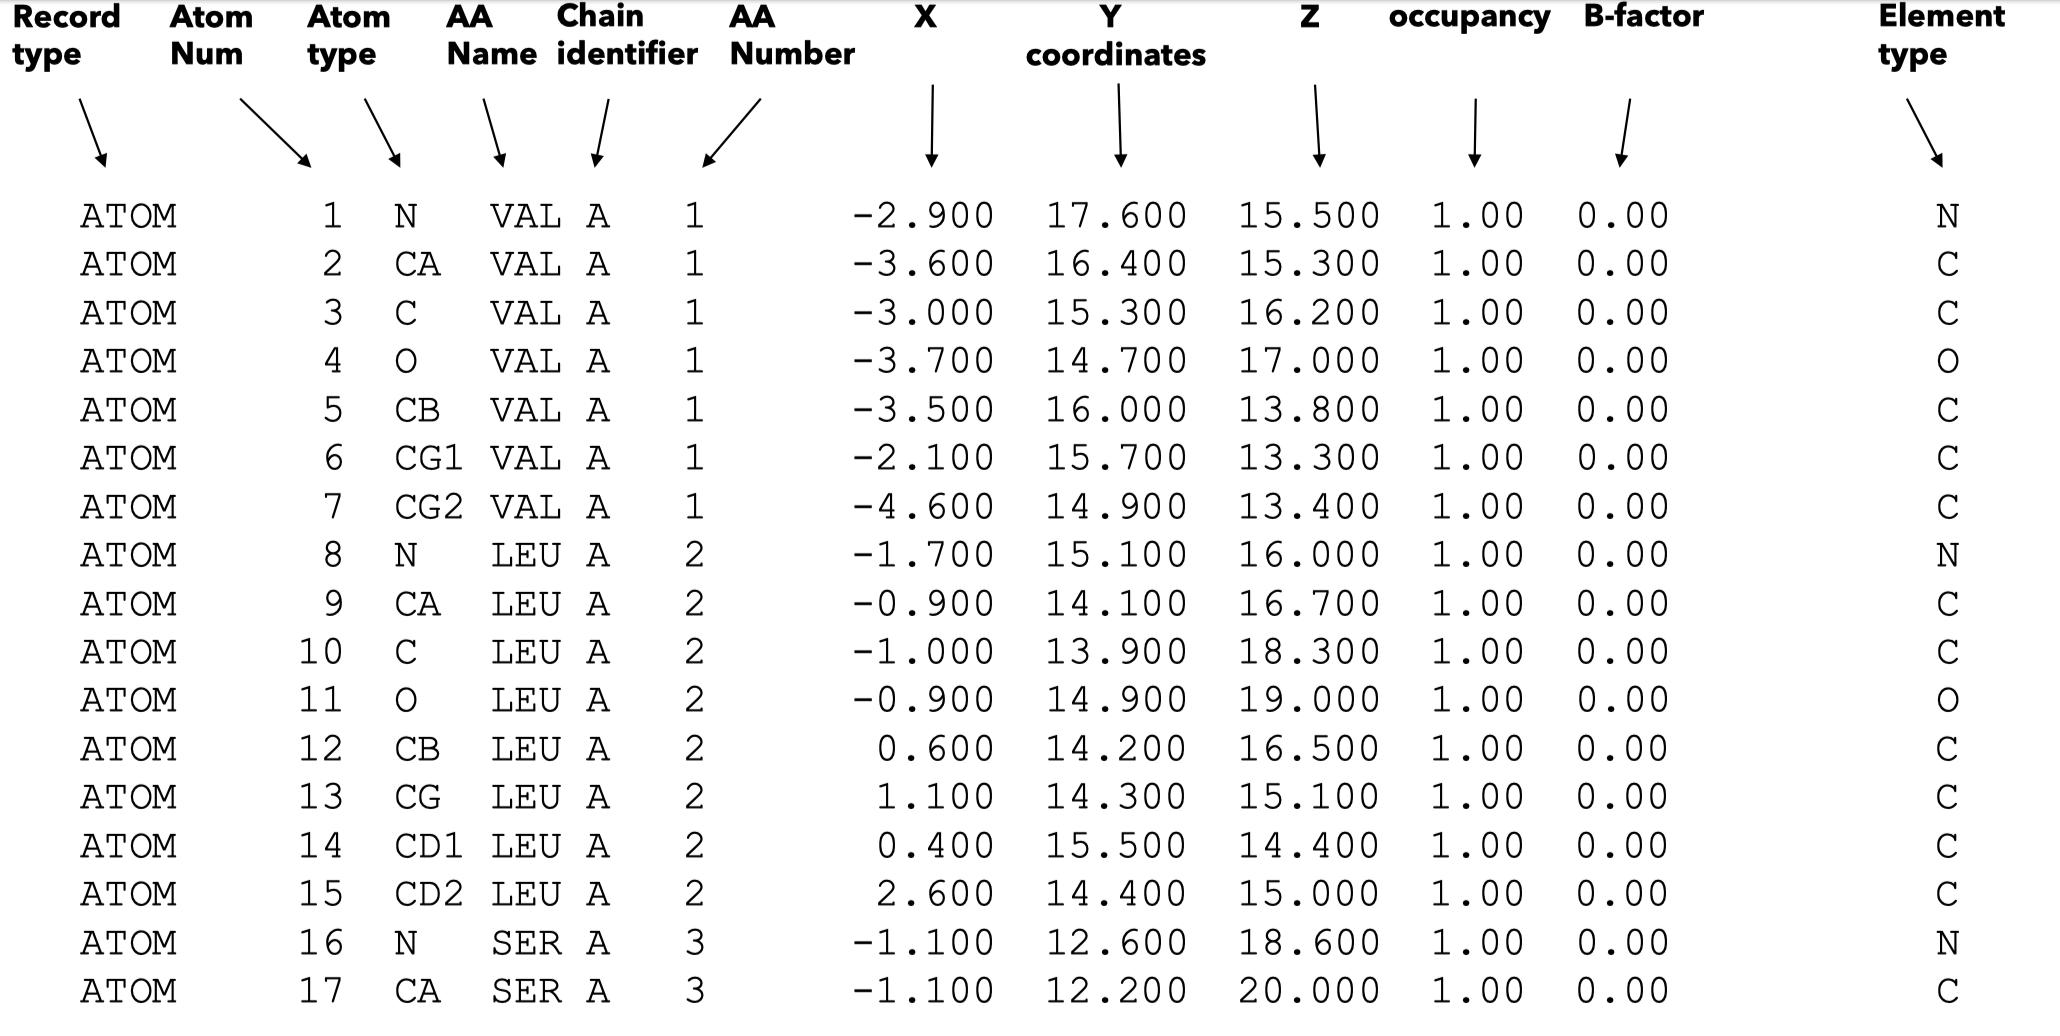
Fig 8. .pdb file example
We can use some associated Softwares to visualize the coresponding 3D structures(SwissPDB-viewer,ChimeraX, Rasmol), we can also access the structure information via UniProtKB, here is an quick example.
As the development of Machine Learning models, more specificly, the Neuron Network, DeepMind developed an predictive model named AlphaFold which set off a wave in the field of computational biology. AlphaFold can receive a sequence as its input and predict its corresponding structures with the trained deep-learning model, it now serves as a powerful tools in a lot of different research fields like protein design or target identifying.
Another predicting model is SWISS-MODEL, which was developed by SIB, but it use the method of comparative modeling, algning the input sequence to known PDB structure, although it also has a high accuracy, it’s difficult to find a high quality template for the query sequence to align with.
1.4Other Databases
Apart from sequence databases and 3D structure databases, other biological databases also exist, if we open NCBI we can see a list as shown in Figure 9, except proteins, RNAs and DNAs, we can also access the database for SNPs, which allow us to find human specific human specific variations and its frequency and positions. Also in NCBI genome database, we can find the reference genome of various species.
SNP (Single Neucleotide Polymorphisms) are some unique genetic differences between individuals
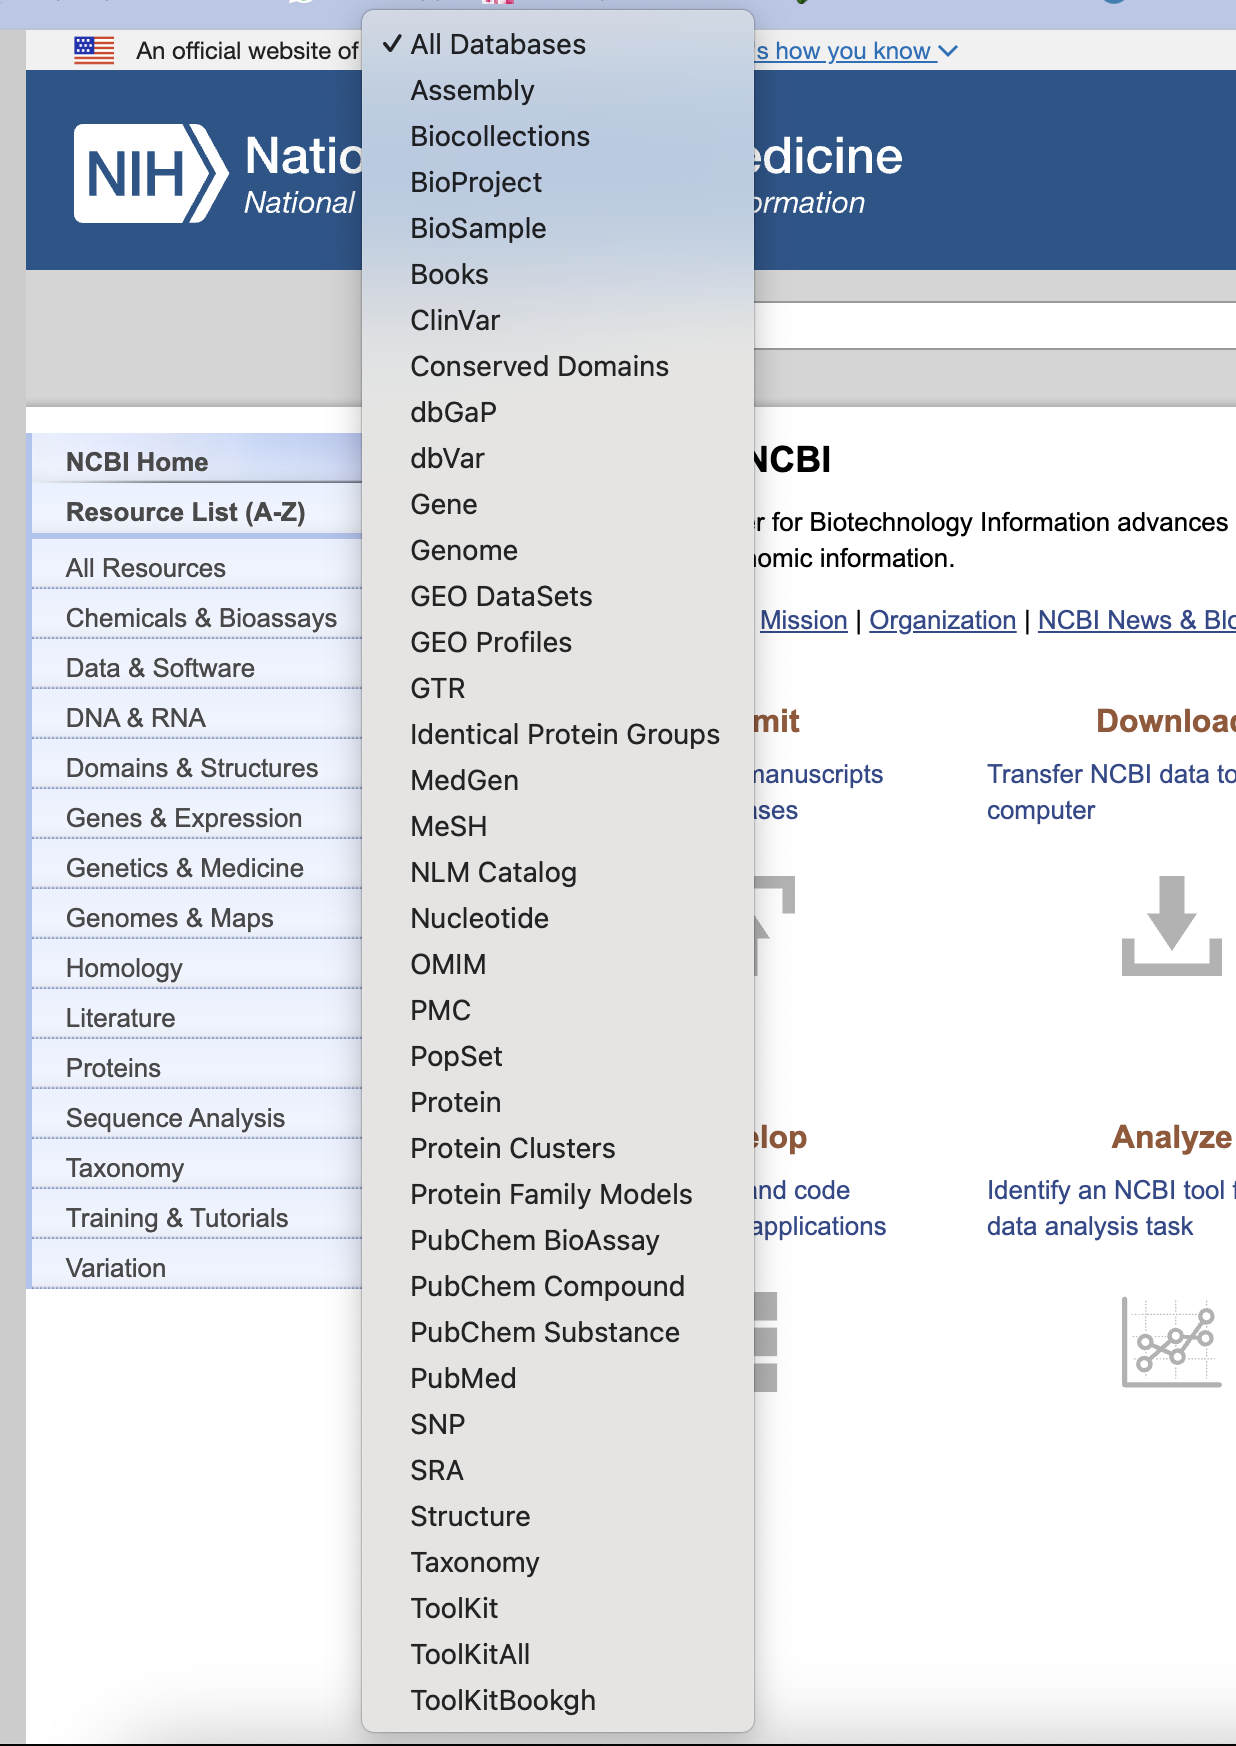
Fig 9. NCBI database list
We now have databases for sequences, proteins structures, and even mutations. What else do we need?
Exactly, we need information for certain metabolism pathways or enzyme pathways
Regarding this need, we have ChEBI which focused on small chemicals and describe their biological metabolism pathways. Here is a quick example for what is shown in its entry. In ChEBI, there is also a different term called ChEBI ontology, which describes the hierarchy of its metabolism. We can use this ChEBI ontology to search all proteins involved in certain chemicals’ metabolism pathways in certain organisms, here is an example shows the protein involved in lactose metabolism across organisms.
Another similar database as ChEBI is PubChem maintained by NCBI.
For enzyme reactions, there is Rhea, which has a non-redundant resource of biochemical reactions details(participants, cross-reference) of enzymes instead of enzyme itself. In a word, in Rhea, each entry represent a biochemical reaction.
Rhea is the standard enzyme annotation of UniProtKB database.
As shown in Figure 10, we can find the ChEBI Ontology accesstion in Rhea to find the proteins related to the chemicals produced in this biochemical reaction with UniProtKB. It can be a powerful tool to conduct some data mining.
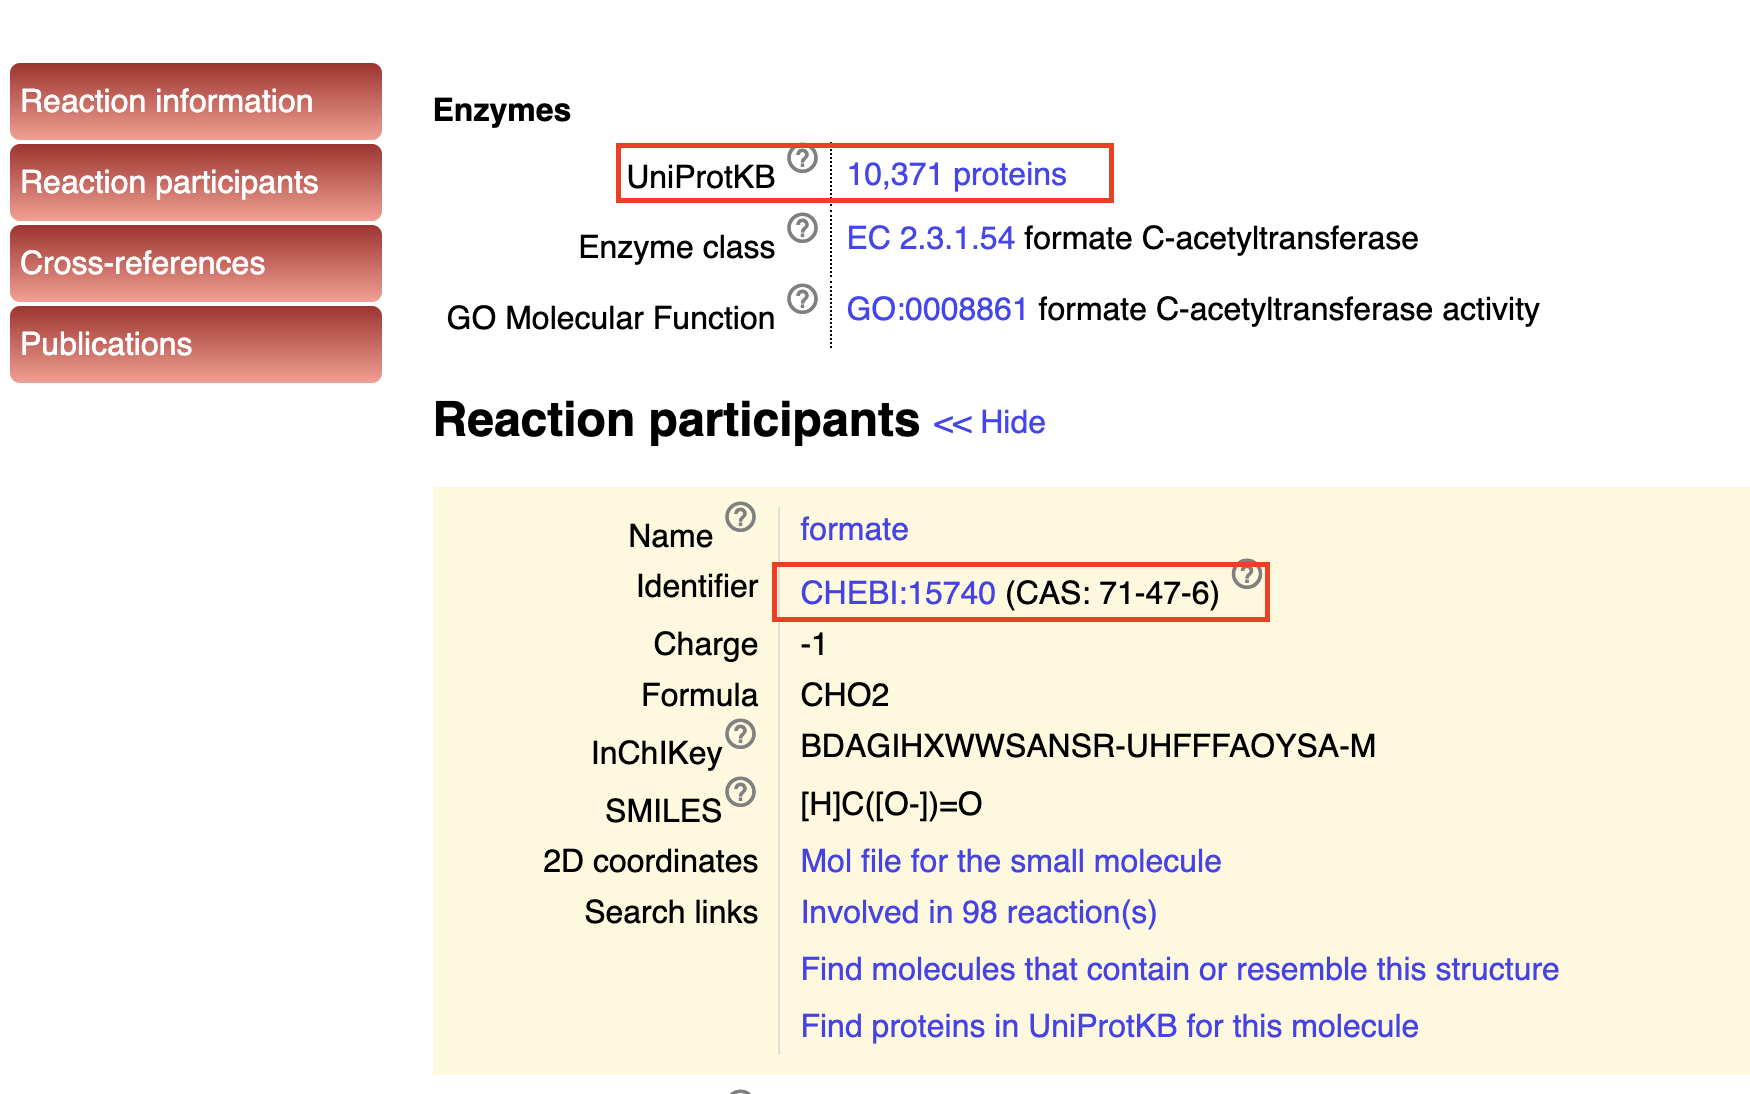
Fig 10. NCBI database list
As for Pathway databases, there are KEGG (manually drawn pathway maps) and METACYC(experimentally vertified database) where we can find the involved pathways of Genes or Proteins. An using example for them is GULO gene, in KEGG, we can compare pathway across different species, and in METACYC, we can search for a single gene or protein to see how many pathways it’s been involved in.
With the development of System Biology, the interactome database which contains the information about Protein-Protein interaction, in UniProtKB databases we can also find the cross-references to the interactome database like IntAct, STRING as shown in Figure 11.
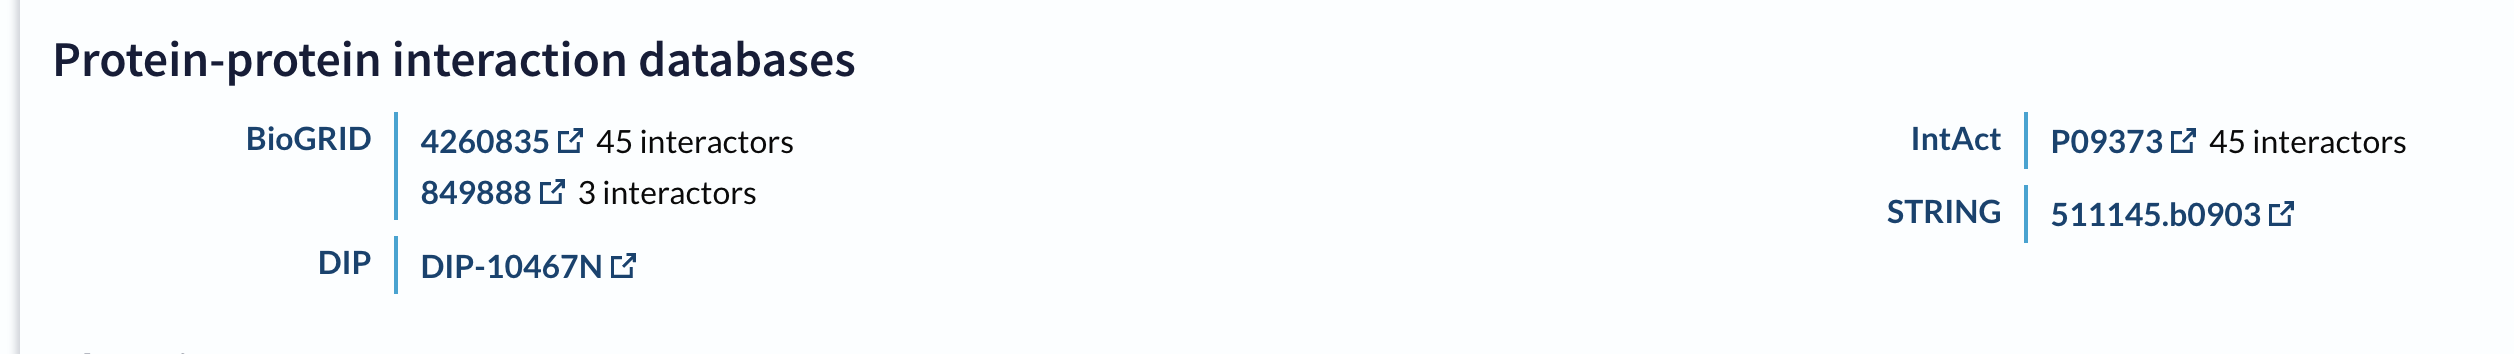
Fig 11. Cross-reference to PPI databases
As mentioned, IntAct is one of the main interactome database, whose data comes form well-verified publications or direct submissions. It can give a PPI network of genes or proteins as shown in Figure 12.
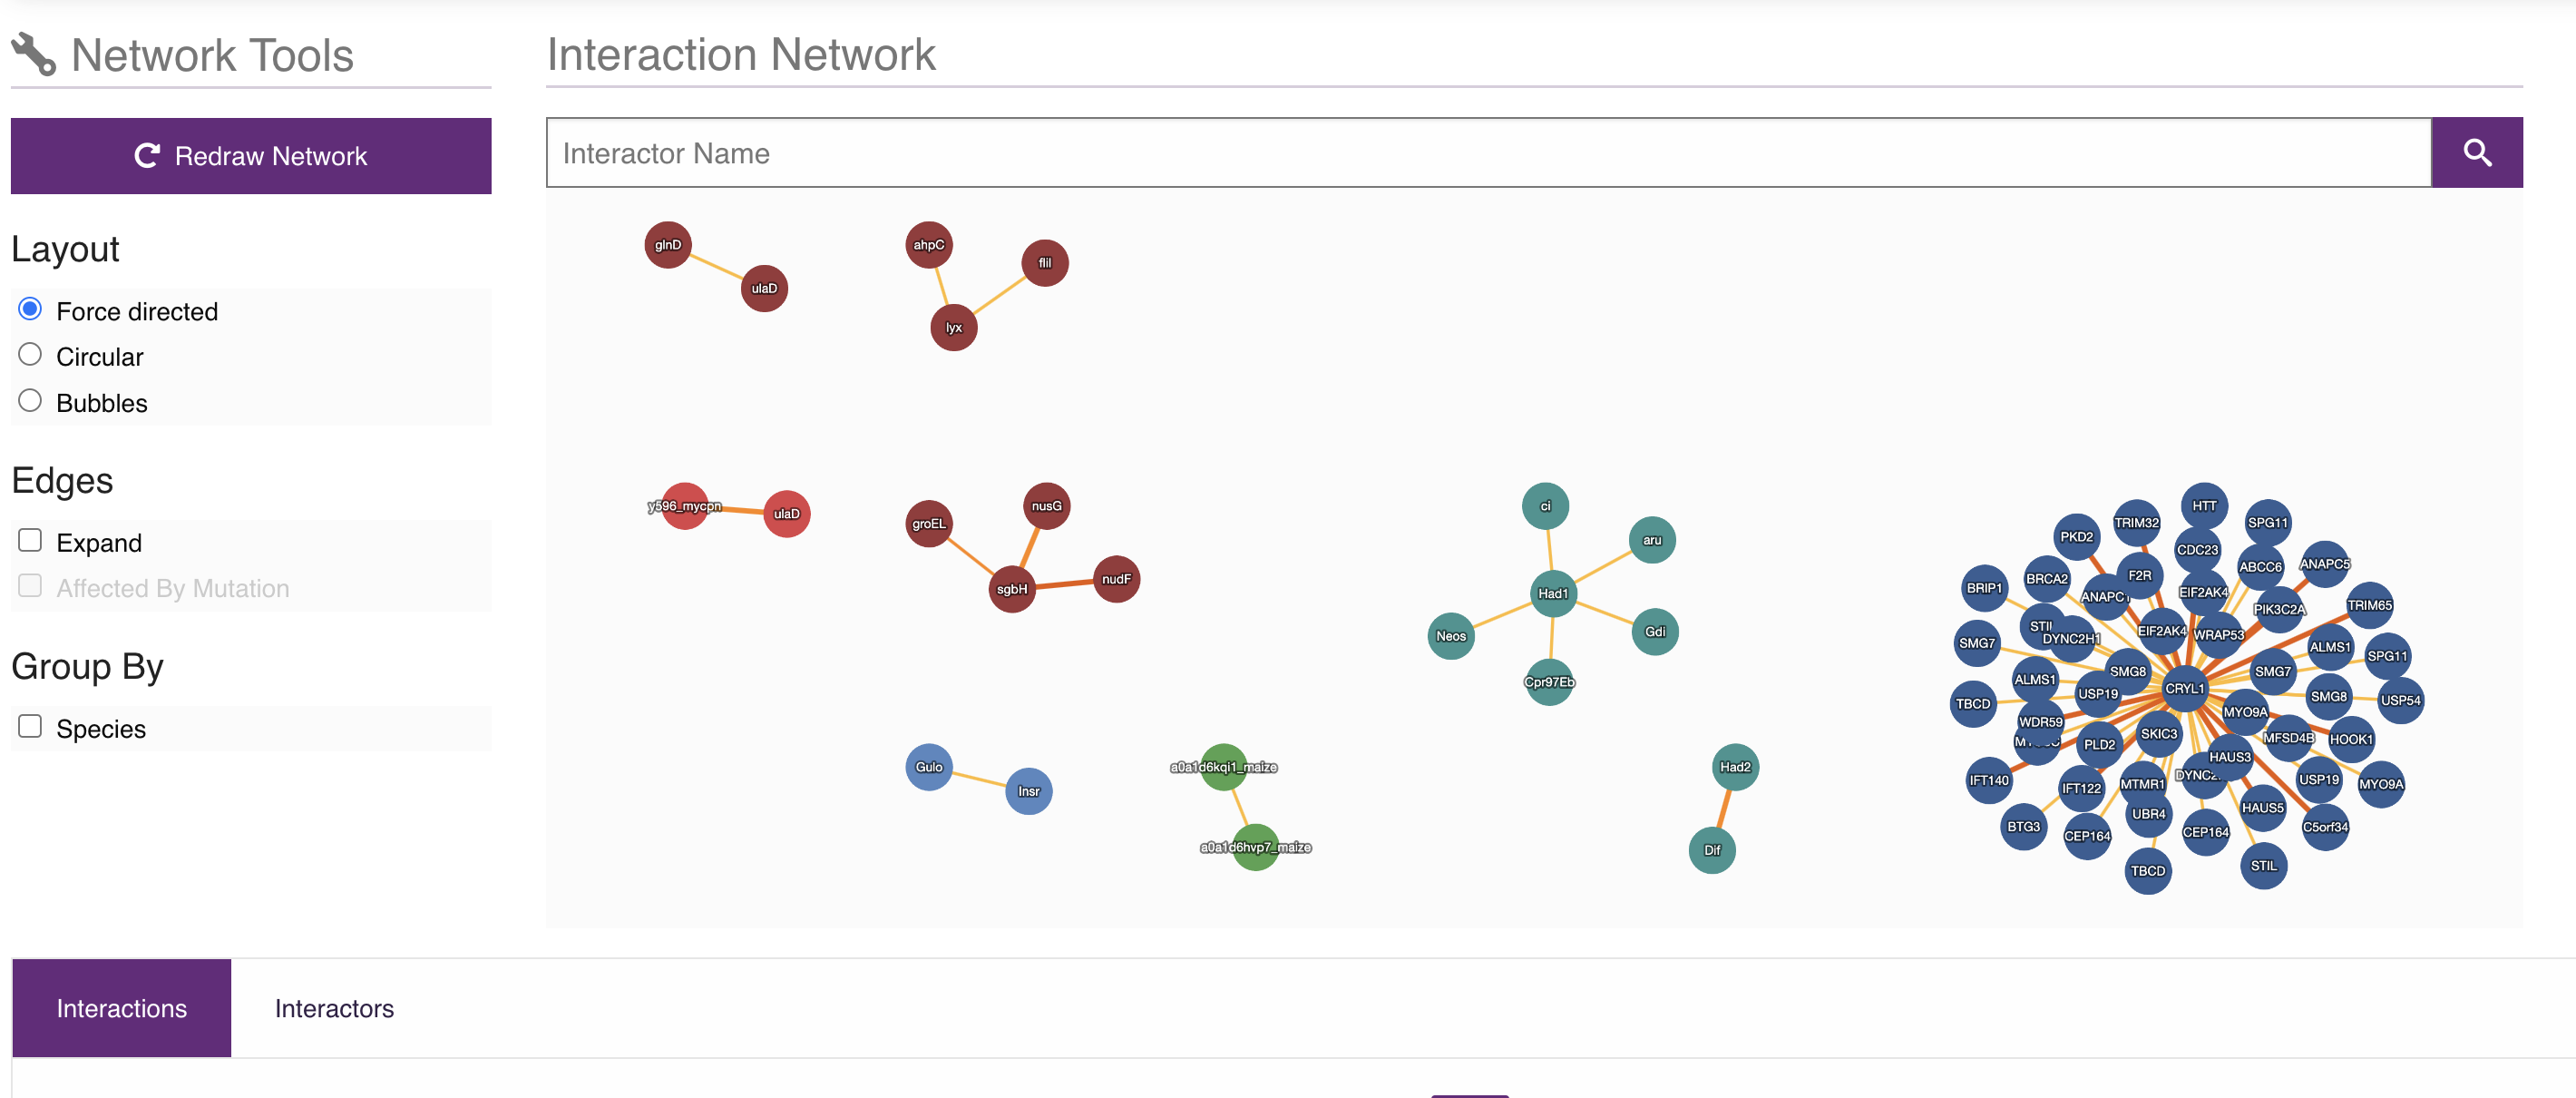
Fig 12. Cross-reference to PPI databases
STRING is also a database focusing on interactions between proteins. It also provide poweful analysis tools like GO enrichment analysis and clustering to mine more information from a given Protein-Protein interaction network. here is an quick search example.
GO Enrichment Analysis(GOEA) is a method to test if certain GO term is enriched in a gene list. Which is a powerful method to see if a given gene list are involved in certein biological phenomenon.
Another important database is PubMed I believe it is already a well-known literature database where you can find the literature about the topics you are interested in. So I’d like not to spend too much time on introducing this database, if you need any assistance you can read the official documentation of PubMed or read this Guide from paperpile.
After introducing so many different biological databases, I believe you already know how to search for biological information of interest, before you start to learn Bioinformatics or Computational Biology, you might underestimate the importance of databases, thinking they are just a collection of data, but you must need to know that Bioinfomatics is basically a branch of data science, in most of the researches, we usually start from data mining, which can give us inspiration of finding out important biological information.
Nowadays, as Machine Learning and Deep Learning has become a trend in Computational Biology, databases also play a key role in providing the training data and Calculating the homologs or the domains of proteins.
In the Next chapter, I’d like to talk more about the methods people using in bioinformatics or computational biology.
2. Bioinformatics and Computational Biological Analysis Methods
Knowing different databases is far from designing a project by yourself, we still need to know some clasic methods used in the bioinformatics study. In this part, I will focous on the method of mining information or make predictions based on existing data.
2.1 Gene Ontology and its associated analysis methods
In the time between 1995 and 2002, which was the gloden age of Genome sequencing, during that time, a lot of new gene databases was created, and this also generated a problem that we can not only use the nomenclauture to annotate the gene’s functions or other characteristics.
And someone come up with a idea to design an ontology for genes at this time point.
Ontology is a set of concepts and categories in a subject that shows their properties and relationship between them.
Ontology usually has two elements: Classses(nodes) and Relations(edges), as shown in Figure 1, this is the formal representation of the knowledge in a domain of interest. Figure 1 means “Class ‘C1’ is related to Class’C2’ by the relation ‘R1’ “.
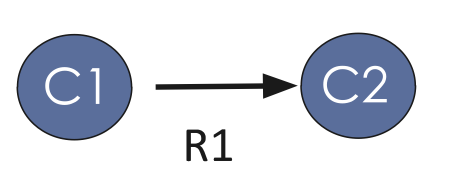
Fig 1. Element in ontology
This stucture makes ontology usually have a hierarchical relationship among its classes, for example, “neuron” is the subclass(child) of “cell”, and “cell” is the superclass(parent) of “neuron” and each node(class) can have multiple parents or children and with different relations, it can represent a large amount of biological function annotations and can also make them organised. For example, we can make an simple ontology structure like Figure 2
Note: All the relations are inherited, for example, “Rabbit” is also an “organism” and a “vertebrate”
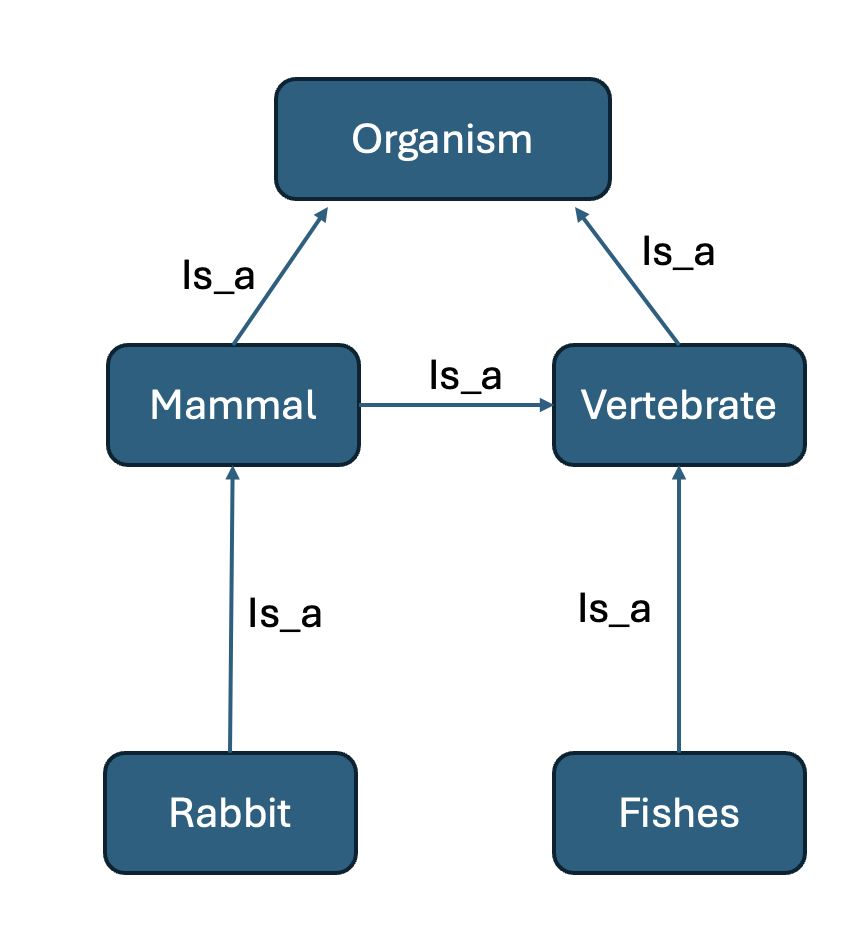
Fig 2. Element in ontology
Now, we have an idea about what is ontology, now it’s easy to understand what is Gene Ontology, GO is just using an ontology structure to describe the biological information of a given gene. For Gene Ontology, we usually have 3 aspects which serverd as the three top class, they are Molecular Function; Biological process; Cellular Component, and the distribution of their subclasses inside these three aspects are uneven. The reason why GO is so widely used not only is it’s strict classification and hieriarchical strutue, it also provide a logic framework to allow computational tools to analyse large datasets and mine more information from a given information.
There are 3 types of GO annotation. They are:
- A statement that links a gene product and a GO term
- A description of the evidence supporting the statement
- A reference citing the source of the information
So a GO annotation of a gene or gene product is usually based on a GO term or some kind of evidence.
These sources make GO a extremely powerful tool for gene function prediction: based on the given GO model of the known gene or gene product and their similarity/homology with the unknown-function gene, we can infer the function of these unknown genes rapidly. Figure 3 shows a work flow to make gene annotations based on a evolutionary relationship(The PANTHER tree is a kind of phylogenetic trees)
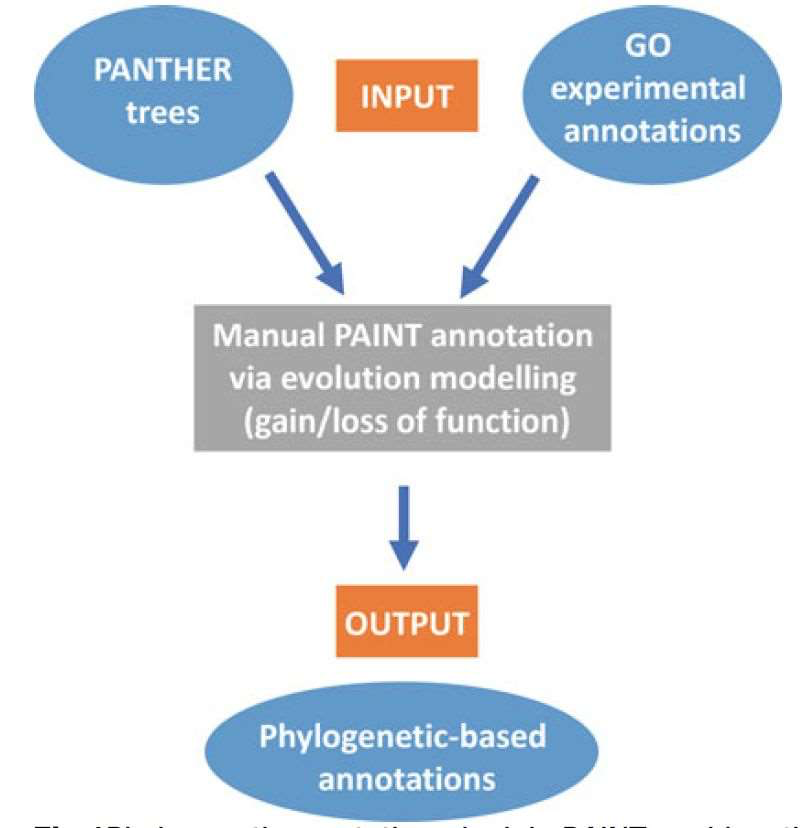
Fig 3. Make gene annotation with Phylogenict way
Apart from manually making annotation, there are also methods that can make annotations automatically. There are over one billion GO annotations are made by automatic methods, for example, the UniProt annotation features like keyword, enzyme pathways can be automatically mapped as GO annotations(Figure 4), as well as domain informations
Since domain are functional modules of protein, some domain can sometime imply some GO terms
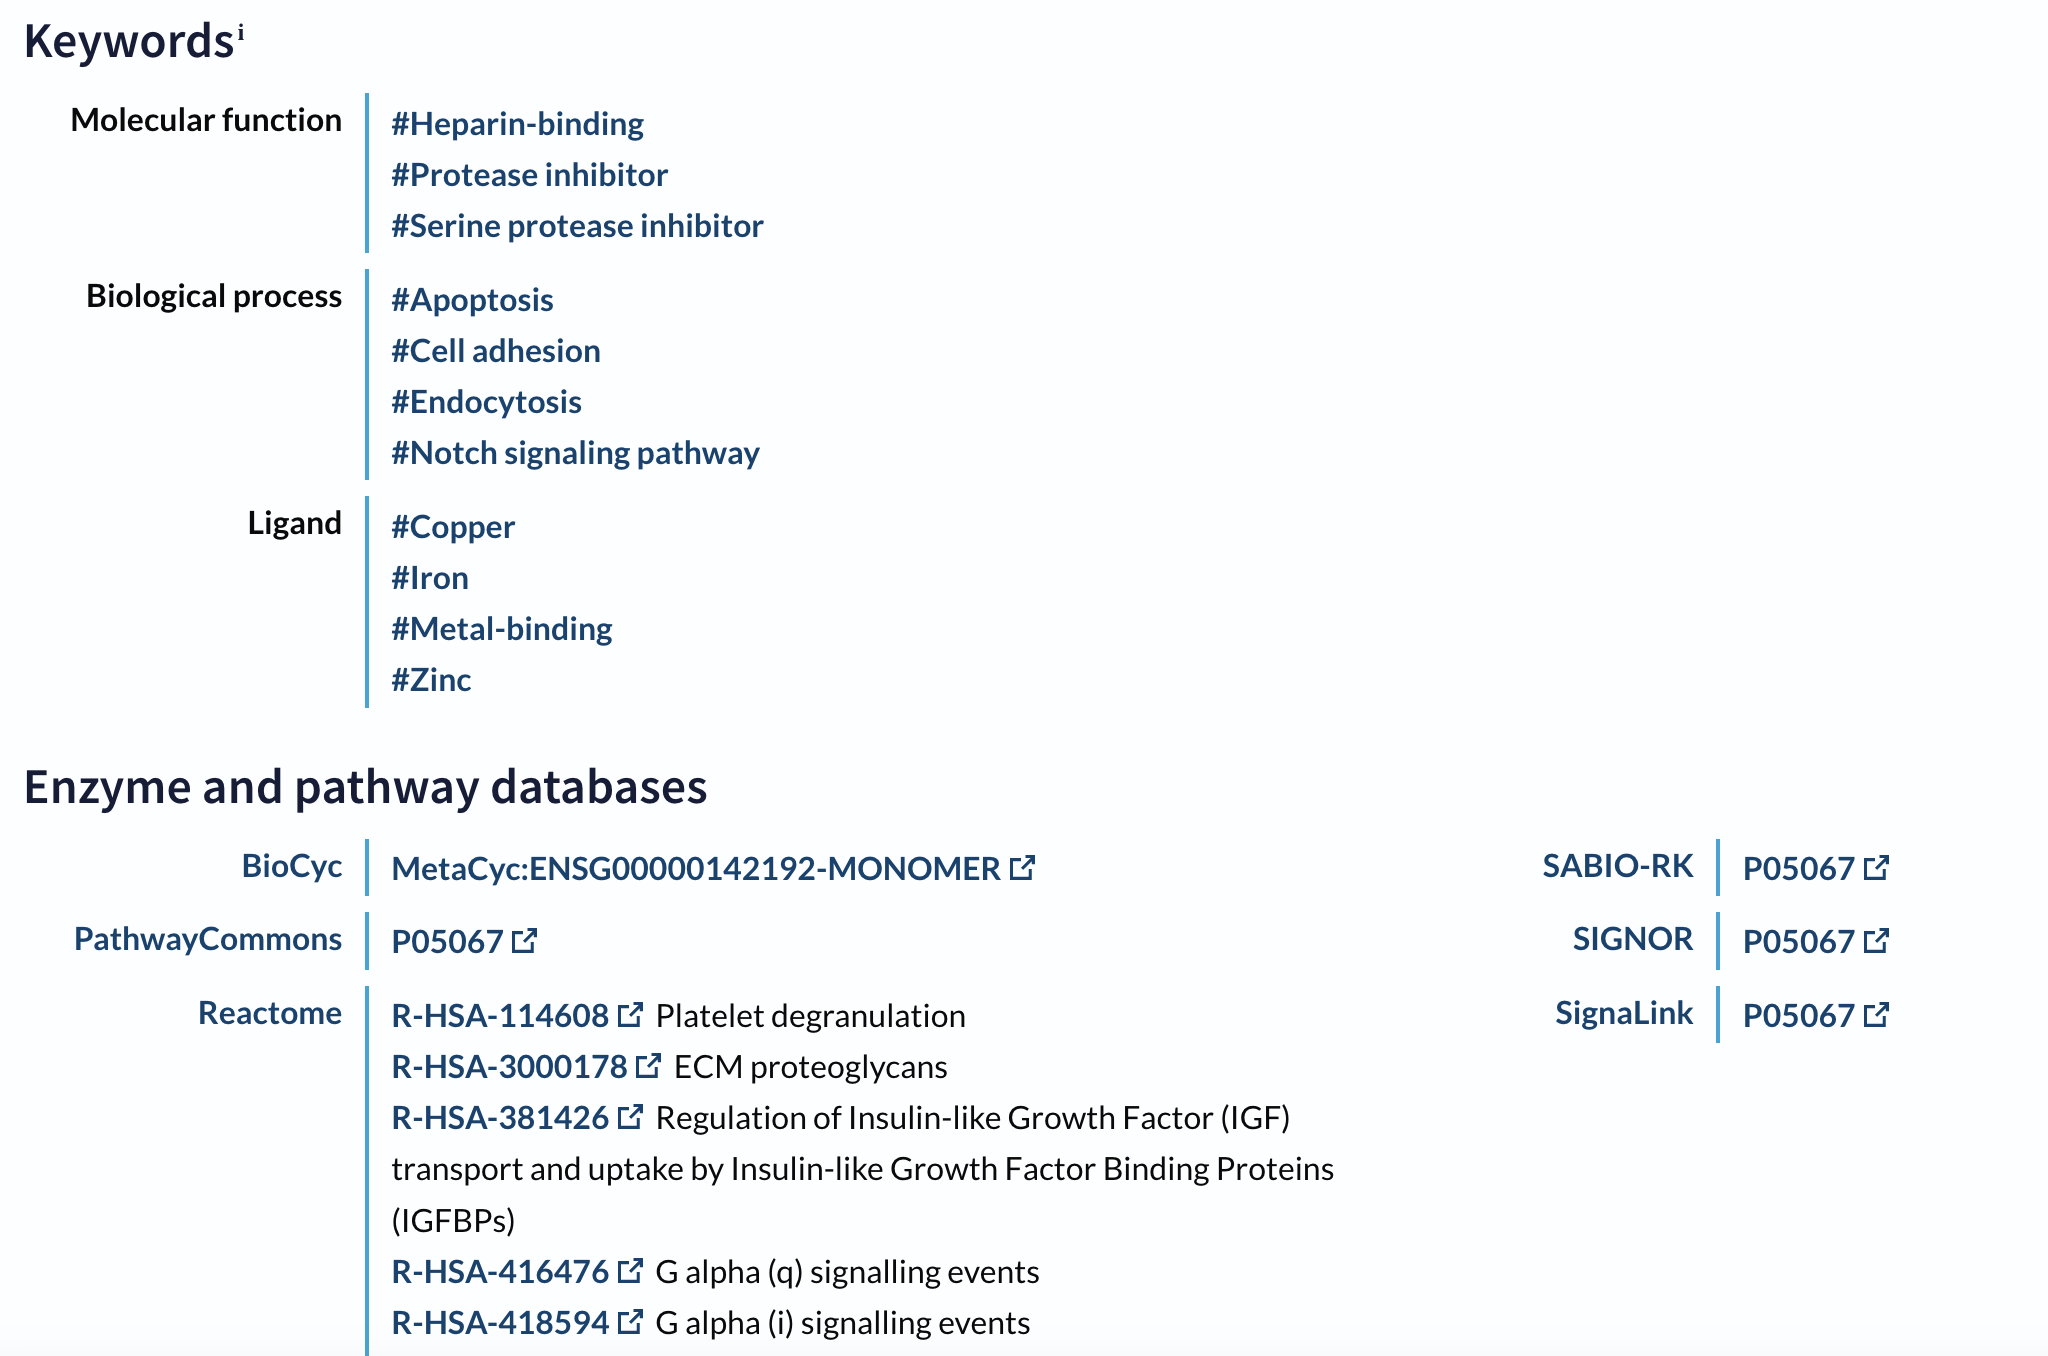
Fig 4. Keyword and Enzyme pathways in UniProt
If we want to access GO data, There are so many different ways, like NCBI, UniProt, we can usually find their GO terms when opening their entries. Also, we can use tools like QuickGO or AmiGO which are more dedicated tools for searching GO terms and making associated analysis.
There is an important analysis method called Gene Set Enrichment Analysis(GSEA)(also called functional enrichment analysis or pathway enrichment analysis) which is a method to identify classes of genes or proteins that are over-represented(or enriched) in a large set of genes or proteins(From WikiPEDIA), for GO terms Over-Represent Analysis, we can just use DAVID(Databse for Annotation, Visualization and Integrated Discovery). Here is an example of the result from DAVID analysis pipeline. Generally speaking, what DAVID does is analysing the gene list you entered as input and the species you choose as background, then it will calculate the counts of genes enriched at specific GO terms compared to background.
Take away: DAVID takes a list of gene as input and returns several significant enriched GO terms in these genes comparing with a background(e.g. entire genome or proteome of the organism).
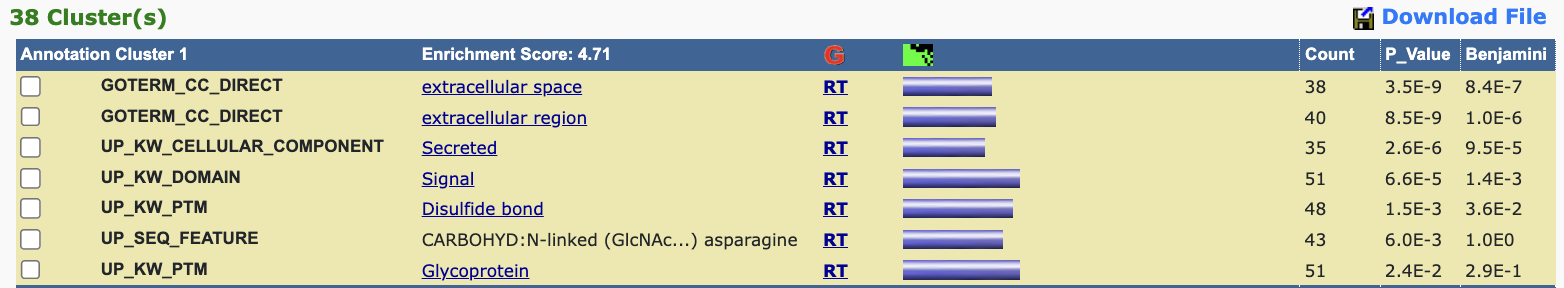
Fig 5. Example of DAVID output
Key concepts showing in the result (Figure 5) includes:
- Fold enrichment: Ratio of observed vs. expected frequency of genes associated with a term.
- p-value: Likelihood of observing the enrichment by chance.
- Benjamini-Hochberg corrected p-value (FDR) : Adjusts for multiple testing to reduce false positives.
For example, if a researcher wants to analyse the Mechanism of Alzheimer’s disease, he might input 200 up-regulated genes from a brain tissue study, and DAVID analysis will take these input genes, for each GO terms DAVID algorithm will calculate 2 values:
- How many genes in your input list are associated with this GO term?
- How many genes in the background(human genome) are associated with this GO term?
After this calculation, DAVID algorithm will calculate the statical values we mentioned above(Fold enrichment, p-value and FDR) to compare which GO terms are more more related to Alzheimer’s disease. To understand this more, I make an example calculation workflow of this process:
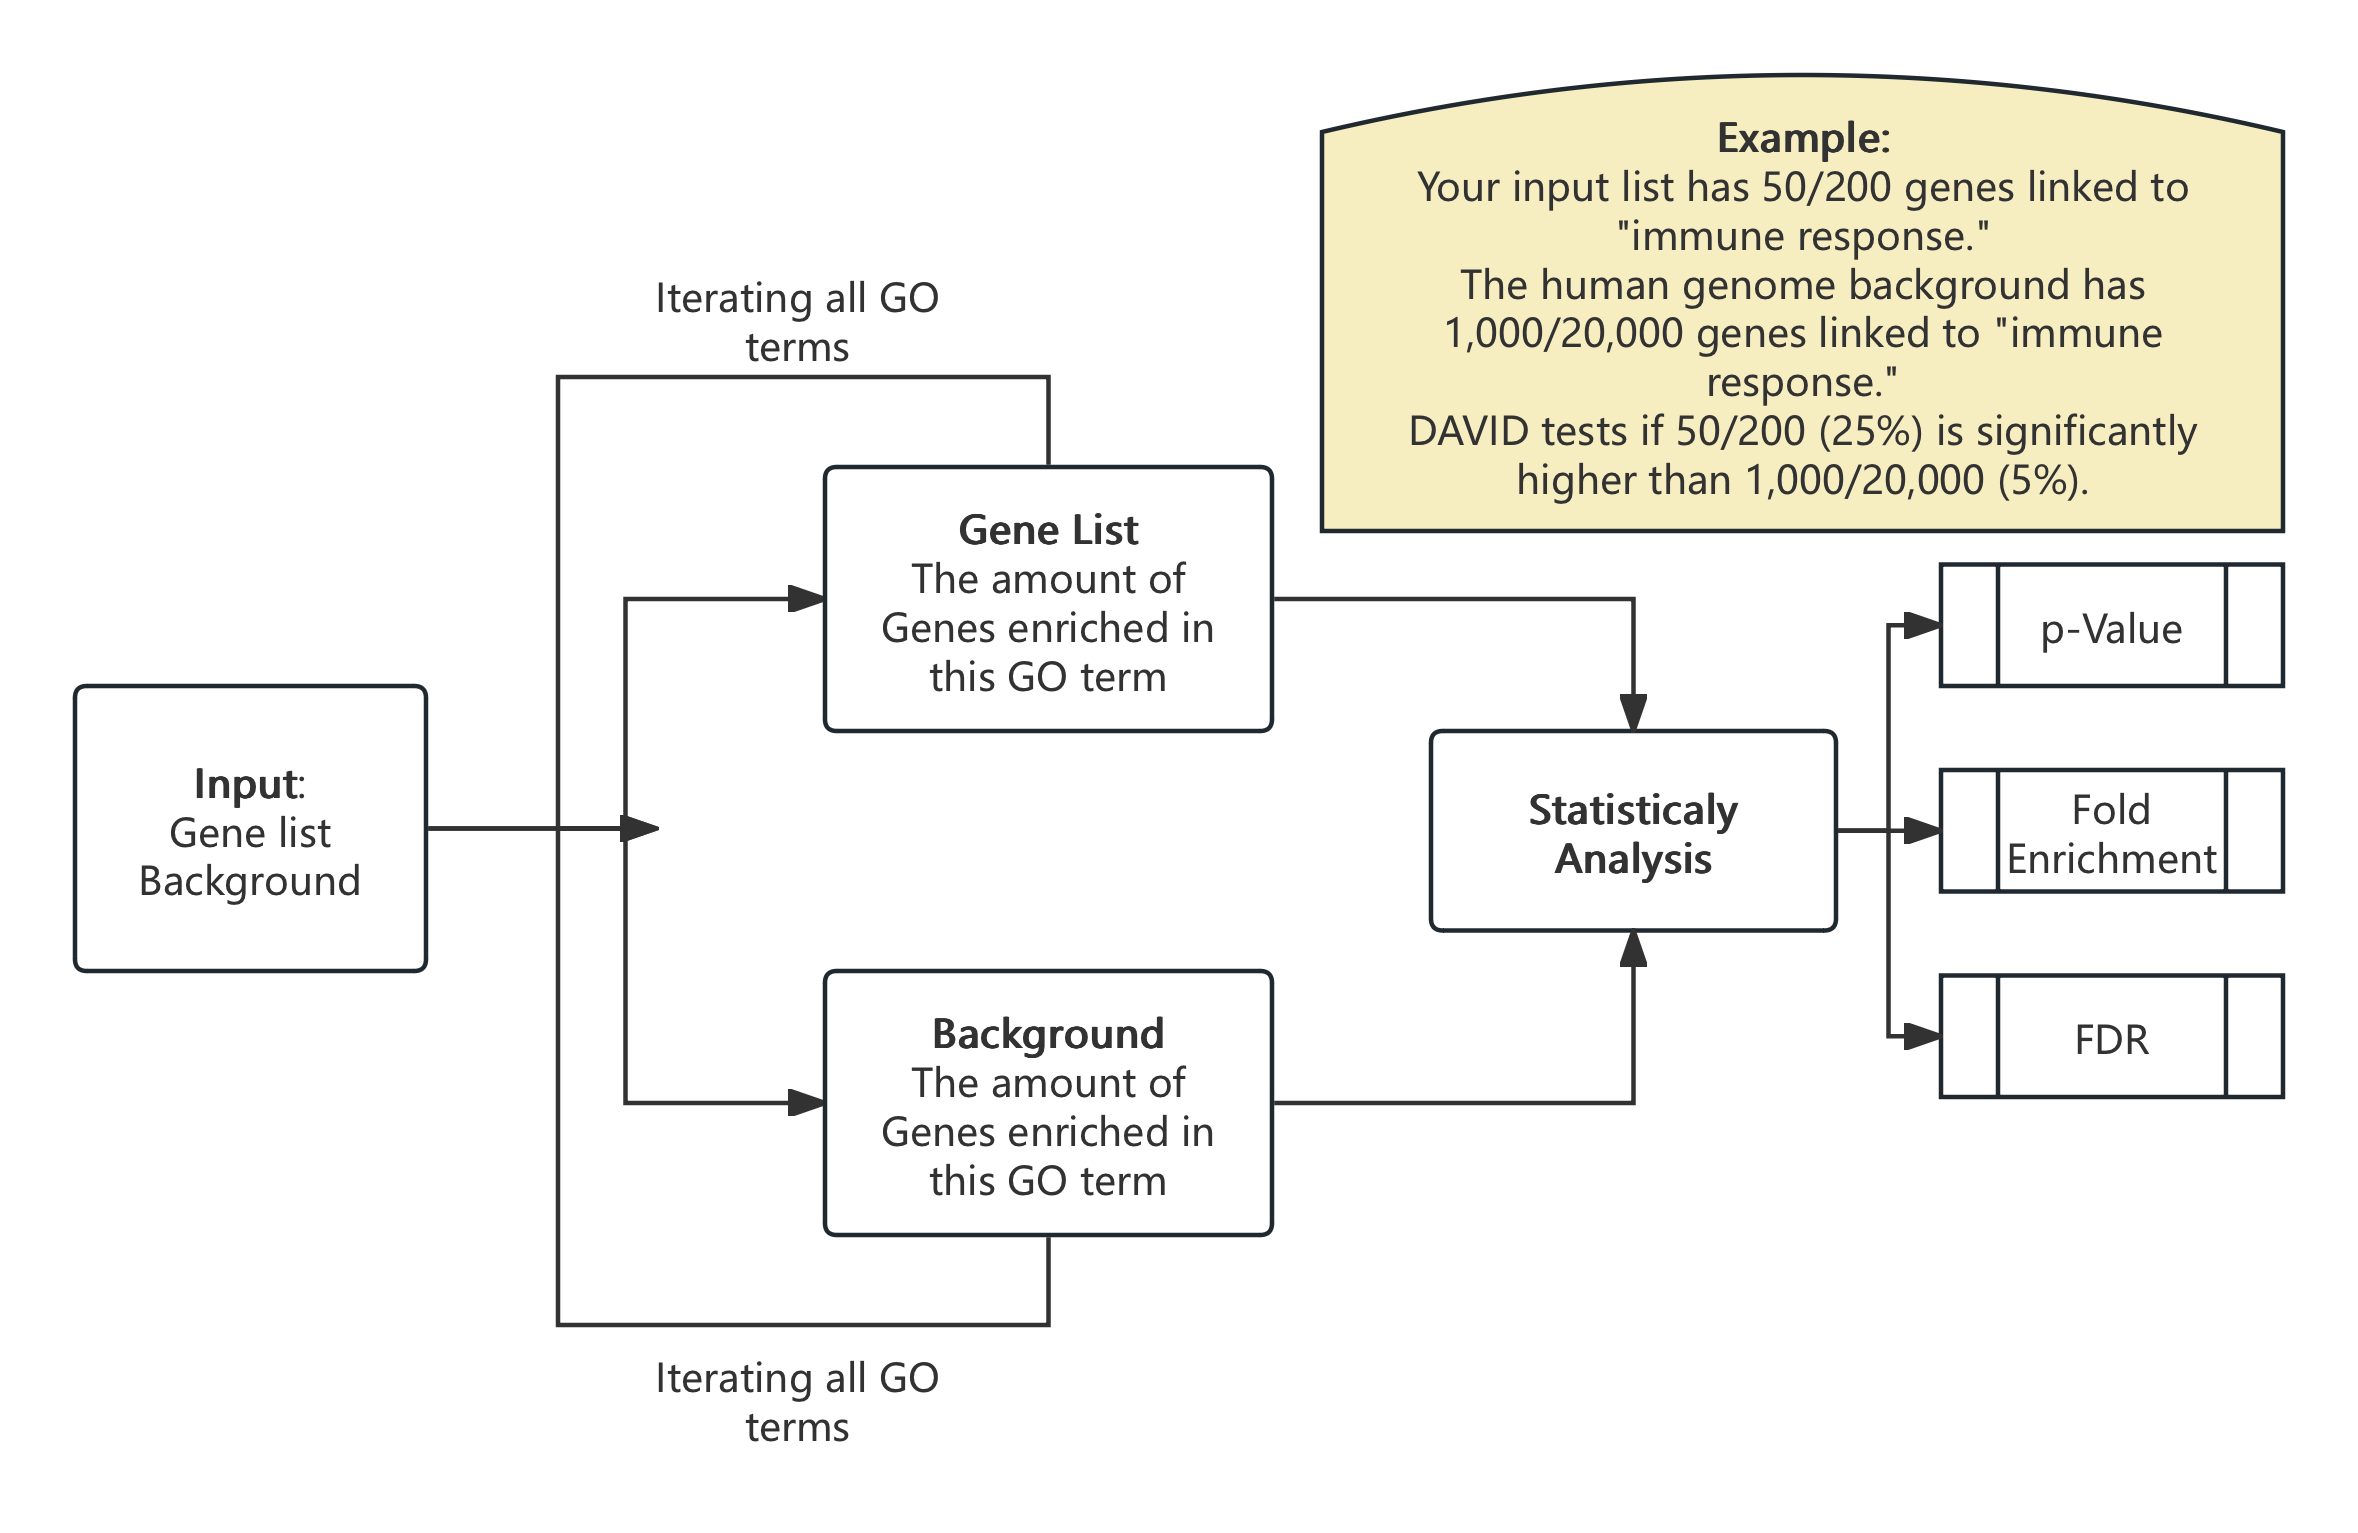
Fig 6. Example of DAVID Calculation process